
Background:
Advanced imaging techniques have shown that the brain is comprised of complex networks that work together to support function. Graph theory adapted for neuroscience allows researchers to quantitatively assess connectivity and derive biologically meaningful brain network metrics. In this study, we use resting state functional connectivity with graph theory to evaluate participants in early HIV infection to investigate network changes over the first two years.
Methods:
Data from the Chicago Early HIV Infection study was used for this analysis. The cohort included 45 HIV+ (42M, 3F, mean age 32.9 +/- 10.6 years, 30 ART naïve, 26 on ART) and 17 seronegative controls (14M, 3F, mean age 31.2 +/- 8.5 years) at baseline. Follow-up data was collected 26.8 +/- 10 months later in 42 HIV+ and 15 seronegative controls. Resting state fMRI data was collected on a 3T Siemens Trio scanner (TR/TE/resolution = 2.5 s/20 ms/1.7×1.7×3 mm3, 235 volumes, 40 slices). After standard preprocessing using FMRIPREP and ICA-based AROMA, RS-FMRI data was spatially normalized to the ICBM 152 Nonlinear Asymmetrical template and smoothed by 4mm FWHM. Average signal from 116 regions of interest (ROI) of the AAL template were extracted and used to calculate graph theory metrics. Global network metrics were averaged over all 116 ROIs and compared between groups using t-tests at each timepoint.
Results:
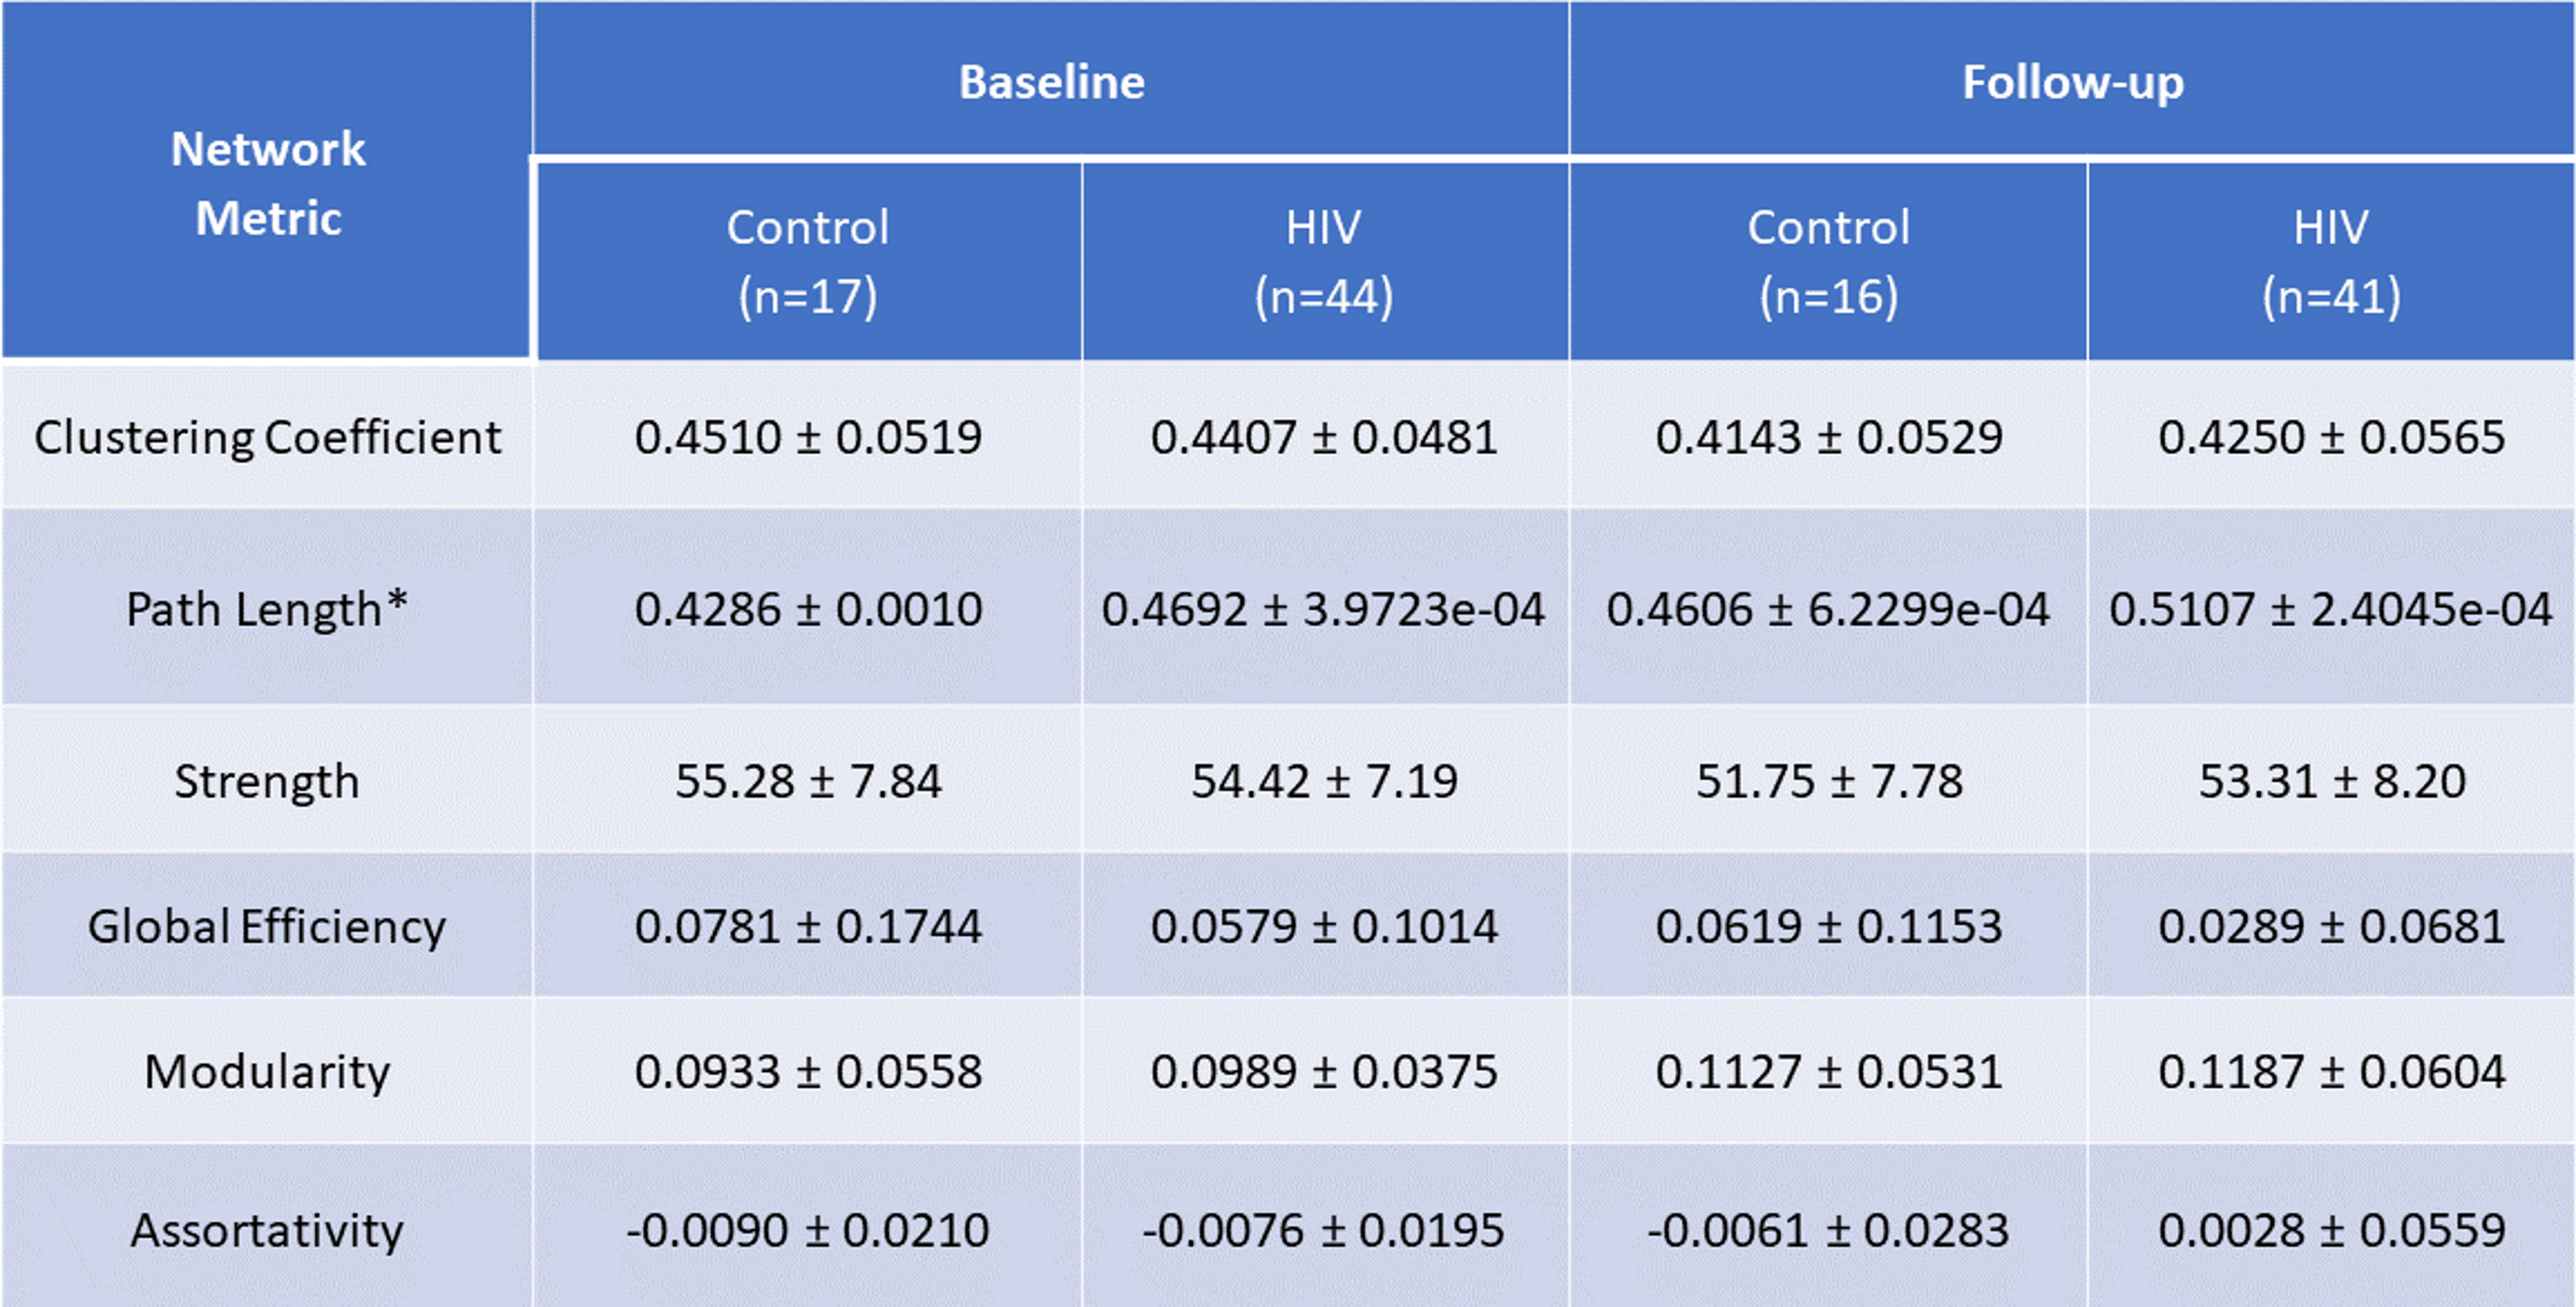
Table 1 shows the mean ± stdev of the global network metrics for the early HIV+ and control groups at baseline and follow-up. Path length for the HIV+ group was significantly longer than for the control group both at baseline and follow-up (* denotes p< 0.001). Other network metrics for the HIV+ group follow a similar finding of network disruption (e.g. decreased strength, global efficiency and clustering coefficient, increased modularity) compared to the control group.
Conclusions:
We found significantly longer path length in HIV patients compared to healthy controls at both baseline and two-year follow-up. Path length, which represents the shortest distance between two nodes, is frequently used as a measure for network integration. Our results demonstrate that network efficiency is affected during the early period of HIV infection and that this continues to worsen with infection duration. These findings may provide insight into the development of HIV associated neurocognitive disorder in virally suppressed HIV patients.
Table 1: Global network metrics at baseline and follow-up for HIV and control groups. (mean +/- standard deviation. * denotes p < 0.001)