
Background
The interplay between HIV, antiretroviral therapy (ART) and adiposity impacts glucose homeostasis in ways that remain incompletely understood.
Methods
Middle-aged South African women with (WWH) and without HIV (WoH) not taking diabetes medications completed anthropometry, dual-energy X-ray absorptiometry and oral glucose tolerance testing. We estimated glucose area under the curve (AUC), homeostatic model assessment-2 of insulin resistance (HOMA2-IR), insulin sensitivity (Matsuda index), first-phase insulin response (insulinogenic index, IGI), β-cell function (disposition index, DI), fat mass index (FMI) (subtotal body fat/height2) and visceral abdominal fat area (VAT). Diabetes was defined using WHO criteria. We compared glucose profiles, insulin sensitivity and secretion, and β-cell function between WWH and WoH overall and stratified by BMI (<25kg/m2 vs. ≥25 kg/m2) adjusting for sociodemographic and lifestyle factors.
Results
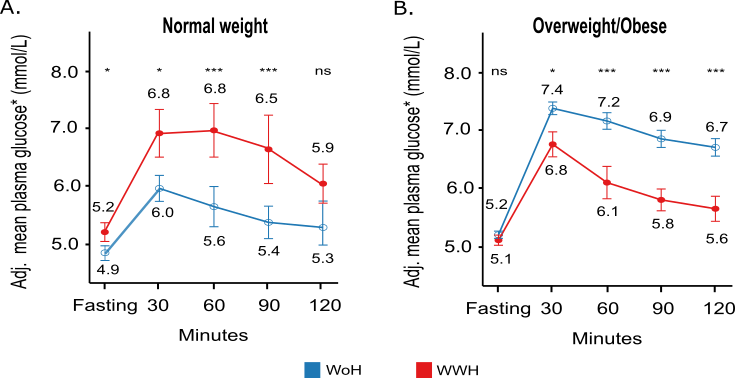
WWH (n=77; median CD4+ 564 cells/mL; median ART duration 4.8 years; 2 NNRTI/1 PI: 92.1%) were younger (mean [SD] age 51.5 [5.8] years) than WoH (n=368; 54.8 [6.1] years; p<0.001). Mean FMI and VAT were comparable between WWH and WoH with either normal-weight (FMI: 7.1 vs. 7.9 kg/m²; p=0.095; VAT: 44.2 vs. 49.5 cm²; p=0.50) or overweight/obesity (FMI: 14.5 vs. 15.2 kg/m²; p=0.18; VAT: 106.9 vs. 113.2 cm²; p=0.31). Overall, WWH and WoH had 14.3% and 20.7% prevalent diabetes (p=0.21), respectively. However, normal-weight WWH had higher fasting (5.2 vs. 4.9 mmol/L; p=0.013) and postload (AUC: 783.4 vs. 631.2 mmol/L*min; p=0.004) glucose than WoH (Fig 1). This was accompanied by higher insulin resistance (HOMA2-IR:1.78 vs. 0.69; p=0.013), lower sensitivity (Matsuda index: (5.4 vs. 10.2; mgl2/mU min; p=0.002), higher first-phase insulin secretion (IGI: 83.1 vs. 38.7 mU/mmol; p=0.038) and lower β-cell function (DI: 278.7 vs. 361.5 ng/mmol); p=0.021) in WWH than WOH. By contrast, WoH with overweight/obesity had higher PPG (6.7 vs. 5.6 mmol/L; p<0.001) and glucose AUC (798.0 vs. 748.6 mmol/l*min; p=0.025) than WWH peers, with no statistically significant differences in insulin secretion, sensitivity and β-cell function measures.
Conclusions
Normal-weight WWH had worse glucose metabolic profiles than their peers without HIV. Their increased insulin resistance coupled with inadequate β-cell function may intimate incipient β-cell exhaustion and thus elevated future diabetes risk. Overweight/obesity in WWH, in contrast, may be associated with reduced risk relative to WoH.
Table or Figure