
Background
Traditional metrics of viral suppression fall short of describing the distribution of viral load (VL) control within a population. Understanding this distribution of poor outcomes can help to better target resources to the populations that need it most. We conducted an analysis using the Lorenz curve, an established tool in Economics for measuring inequities within a group, to quantify disparities in viremia in Missouri, an Ending the HIV Epidemic priority state.
Methods
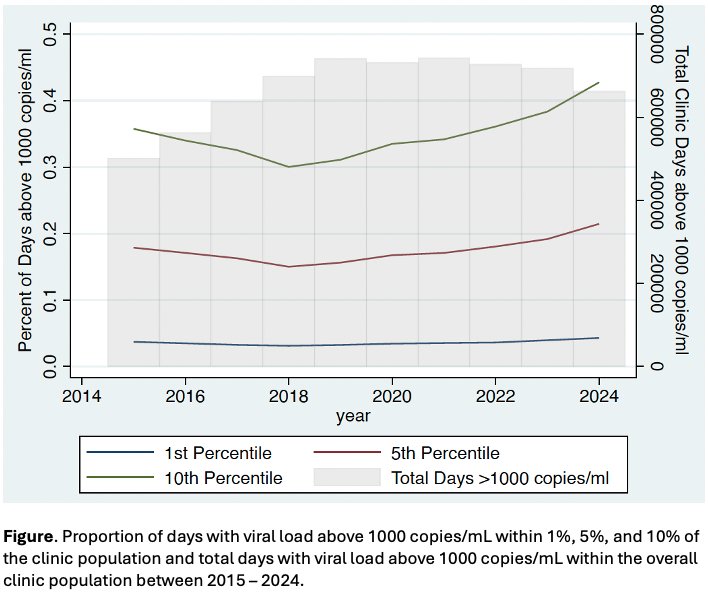
We analyzed electronic health record data collected from people living with HIV ≥ 18 years with at least one VL measurement between January 1, 2015 – December 31, 2024 at a large Ryan White-funded clinic in St. Louis, Missouri. We estimated the daily VL by averaging the two most proximal VLs. We then calculated the total viral exposure in two-year windows (e.g., for 2024, we examined the period from January 1, 2022 – December 31, 2024). We calculated days with a VL > 1000 copies/mL and viremia copy-days (i.e., 1,000 viremia copy-days = 1 day of 1,000 copies/mL or 10 days of 100 copies/mL). Individuals were ranked in order of their total viremia copy-days and the cumulative distribution function was calculated. The cumulative proportion of days with VL > 1000 copies/mL and total viremia copy-days within 1%, 5%, and 10% of the population, and total days with VL > 1000 copies/mL in the clinic population were plotted from 2015 – 2024.
Results
Overall, 3629 patients had at least one VL measurement. Median age was 38 years (IQR 27-49), 2649 (73.0%) were male, and 2516 (69.3%) were non-Hispanic Black. Between 2015 – 2024, the proportion of days with VL > 1000 held by 5% of the population increased from 17.9% to 21.4%, and viremia copy-days increased from 66.0% to 79.0%. The proportion of VL > 1000 held by 10% of the population increased from 35.8% to 42.7%, and viremia copy-days increased from 82.2% to 95.8%. Between 2018 – 2024, total days with VL > 1000 within the clinic population remained similar but increasingly concentrated.
Conclusions
In this analysis, we demonstrate that viremia within a clinic population in Missouri was slow to improve but grew increasingly concentrated within a smaller subpopulation over a 9-year period. Lorenz curve metrics highlight underlying disparities in VL control and reveal an opportunity for more intensive interventions directed towards groups which may benefit the most, thus optimizing overall viral suppression to end the epidemic.
Table or Figure