
Background
As part of the “Response” pillar of the Ending the HIV Epidemic Initiative, the CDC requires jurisdictions to use two methods to detect HIV transmission clusters: time-space (TS) and molecular HIV surveillance (MHS). TS methods use spatiotemporal proximity and MHS uses genetic distance. As the proportion of diagnoses in rural areas in Washington state (WA) has increased (12% in 2020 to 15% in 2024), this project aimed to compare the performance of these two methods in rural areas.
Methods
We analyzed HIV surveillance data from WA (2020-2024) to identify TS and MHS clusters that met CDC’s cluster definitions (TS: annual number of cases in a county > two standard deviations and two cases above the five-year mean; MHS: ≥ five diagnoses in 12 months at ≦0.5% genetic distance). We classified each cluster as urban or rural using the WA’s Office of Financial Management county definition. MHS clusters (which could span multiple counties) were categorized based on the modal value of their individual cluster members.
We quantified the number and proportion of clusters in rural areas, as well as the proportion of new diagnoses in urban vs. rural areas included in clusters. We calculated agreement of the methods in terms of individuals (proportion of individuals detected by one method also detected by the other) and clusters (proportion of clusters occurring in the same county during the same calendar year) by rurality. Finally, we compared completion of HIV genetic data by rurality using a chi-square test.
Results
From 2020 to 2024, there were seven TS clusters (n=131) and seven MHS clusters (n=84) in WA. Three TS clusters (43%) were classified as rural. Three MHS clusters (43%) contained both urban and rural counties but were predominantly urban; the remaining four were urban.
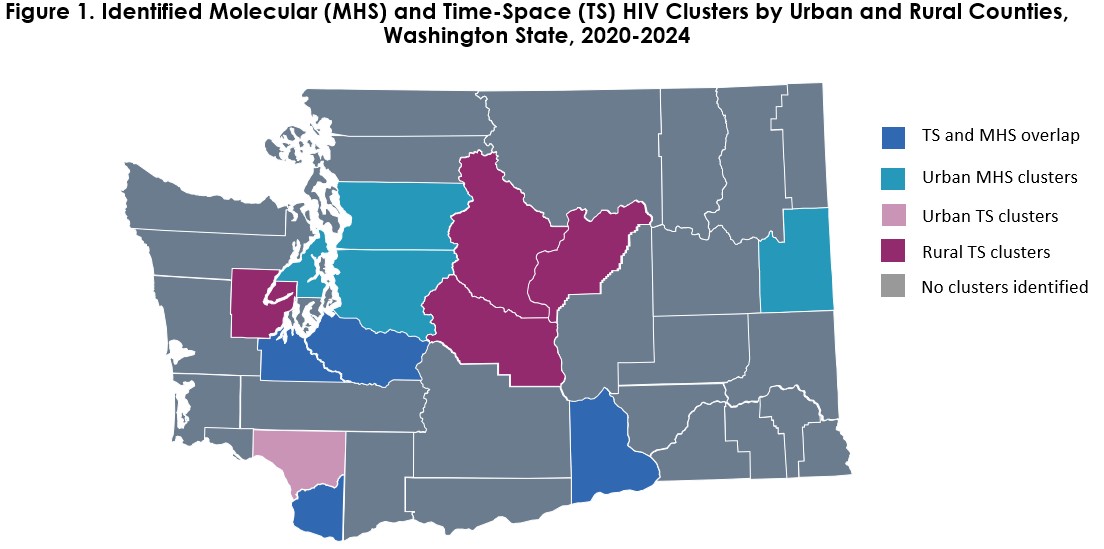
In rural areas, 20% of new diagnoses were included in clusters (95% TS, 5% MHS) compared with 40% in urban areas (87% TS, 13% MHS). Only 2% of people identified in a TS cluster were also identified in an MHS cluster, and 3% of people identified in MHS clusters were also in TS clusters. Four clusters overlapped at the county level (Figure 1). There was no difference in completion of genetic data between urban and rural counties (68% vs. 69%; p=0.64).
Conclusions
Each cluster detection method identified distinct clusters in W. While all MHS clusters were urban, almost half of the TS clusters were in rural counties. In jurisdictions with increasing rural HIV diagnoses, it is vital to use methods effective in both settings.
Table or Figure