
Background:
Early establishment of an effector function following viral inoculation has been proposed as a major driver of viral reservoir control in nonpathogenic SIV infection. The capability of lymphoid tissues (LT) to promptly expand following antigen presentation (LT elasticity) has not been studied in natural and non-natural hosts of SIV infection. In this study, we investigated changes in LT volumes and tissue glucose metabolism in African Green Monkeys (AGMs) and Rhesus Macaques (RMs) during the early days following SIV inoculation, using 18F-Fluordeoxyglucose (FDG)-Positron Emission Tomography (PET)Computed Tomography (CT).
Methods:
Six AGMs and 5 RMs were inoculated intravenously with 300TCID50 SIVsab and 300-1000TCID50 SIVmac viruses, respectively. We here report image analyses up to Day 42 post-infection (p.i.). Whole-body PETCT scans were administered at baseline, Day 3, 7, 10, 14, 21, and 42 p.i. LT volumes of interest and radiotracer uptakes (reported as standardized uptake value, SUV) were obtained by two independent operators by drawing regions in MIM software. Plasma viral loads and peripheral blood CD4+ T-cell counts were monitored throughout the follow-up.
Results:
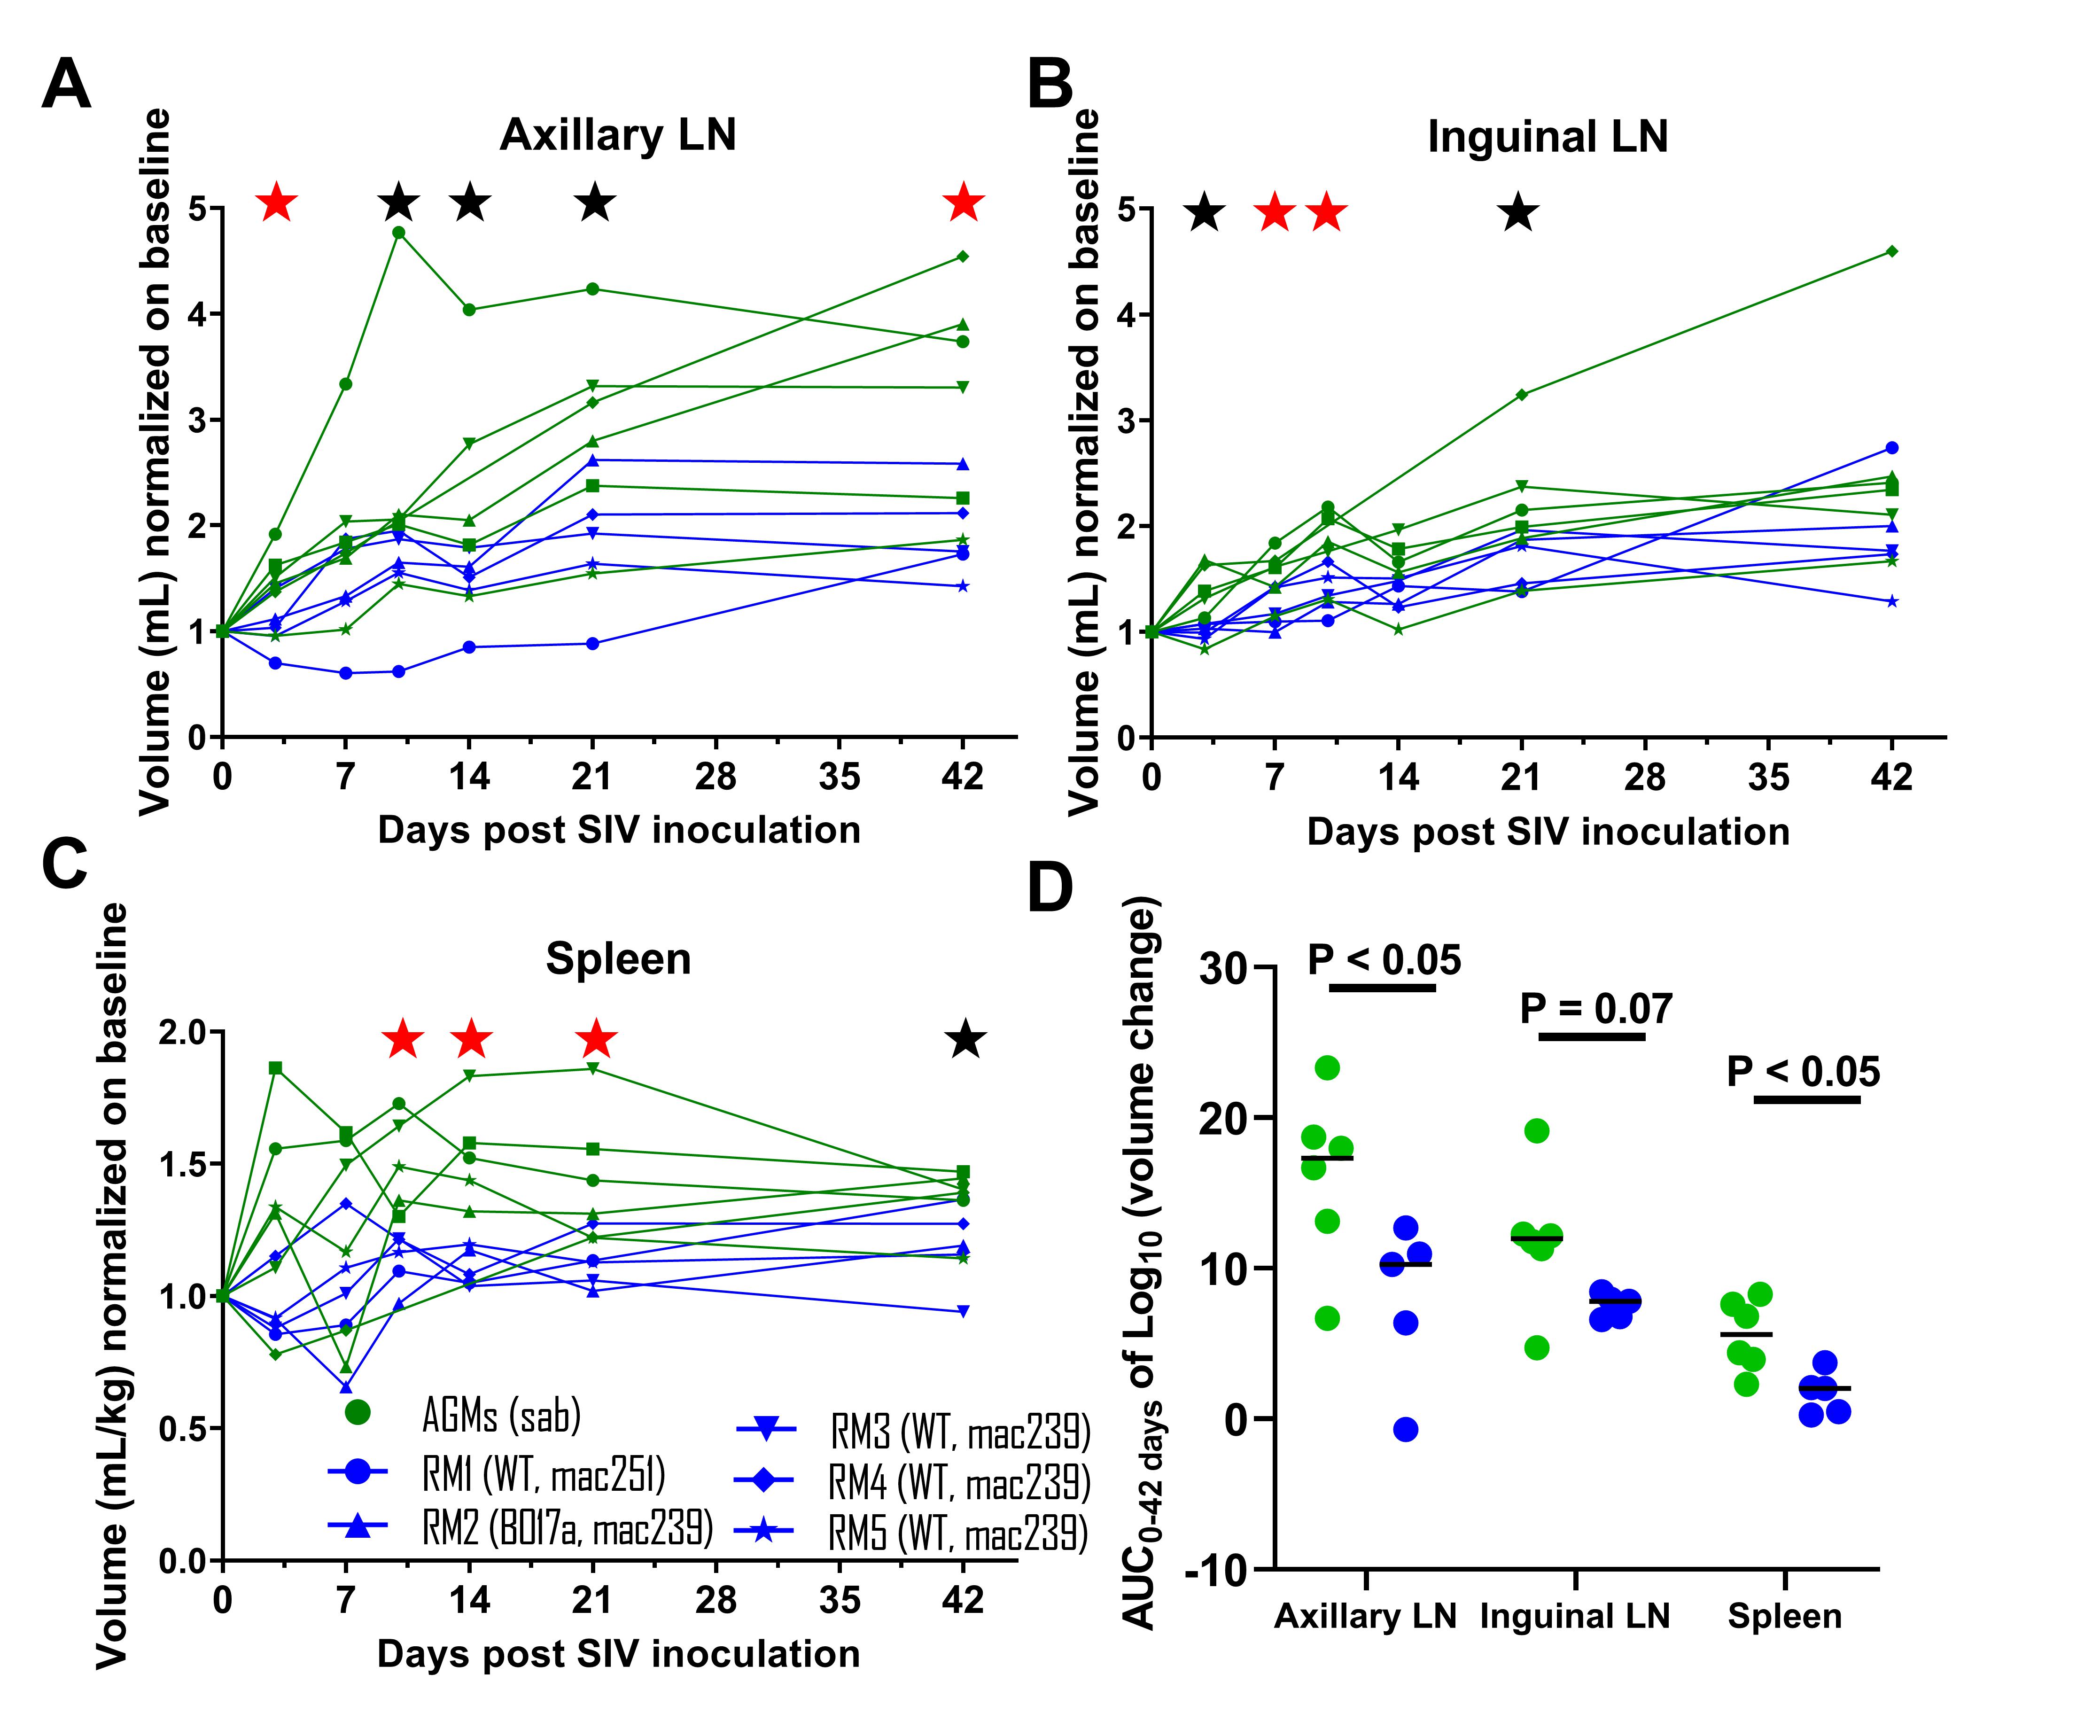
Plasma viremia at each timepoint, peak, and area under the curve (AUC0-42days) was similar between AGM and RM groups. Based on the CD4 count crash at Day 42 (20-80% drop, P < 0.05) and all available follow-up (5-19 months p.i.), all RMs displayed normal disease progression ( >65% CD4 drop at nadir). Starting at Day 3 p.i., a statistically significantly higher expansion of LTs was observed in the AGM group (Figure 1A, B, and C; P < 0.05 (red star), P < 0.1 (black star)). Consistently, AUC0-42days of the relative expansion of LTs was higher in the AGM group (Figure 1D). Compared to baseline, tissue glucose metabolism levels in LTs at Day 42 p.i. were statistically significantly higher in both groups (P < 0.05), with a higher increase observed in the AGM group (P < 0.05 for spleen and inguinal lymph node (LN)).
Conclusions:
PETCT imaging during the early days of SIV infection revealed a prompter expansion of LTs in the AGM group compared to the RM group, accompanied by an increase in tissue glucose metabolism. Future studies will focus on mechanisms responsible for LN expansioncontraction (e.g. molecular pathways governing the elongation of fibroblastic reticular cells) as well as on longer follow-up of LT volumetric analyses coupled with 18F-FDG-PET imaging to suggest alternative functional cure strategies.
Figure 1