
Background
We previously demonstrated that individuals with tuberculosis (TB) and uncontrolled diabetes mellitus (DM) had a lower risk of TB-treatment related adverse drug reactions. Hypothesizing that this could be related to low TB drug levels, we correlated isoniazid (INH) plasma concentrations with glycated hemoglobin (HbA1c) levels
Methods
We included culture-confirmed, drug-susceptible, pulmonary TB participants from the RePORT-Brazil cohort, who received standard TB treatment between 2015-2019. We considered baseline HbA1c as both a continuous and categorical variable (HbA1c<5.7% was considered normal, HbA1c ≥5.7%-<6.5% was pre-DM, and HbA1c ≥6.5% was DM). Plasma samples were collected within 8 hours of the previous TB drug dose at two time points (months 1, 2) and drug concentrations for INH were quantified by liquid chromatography-mass spectrometry (SCIEX6500 Qtrap, Redwood City, CA). We log-transformed the INH concentration (log-INH) and we considered the time since last dose in hours. We built time-to-concentration curves, and we used Spearman correlation to compare the INH according to HbA1c levels and categories.
Results
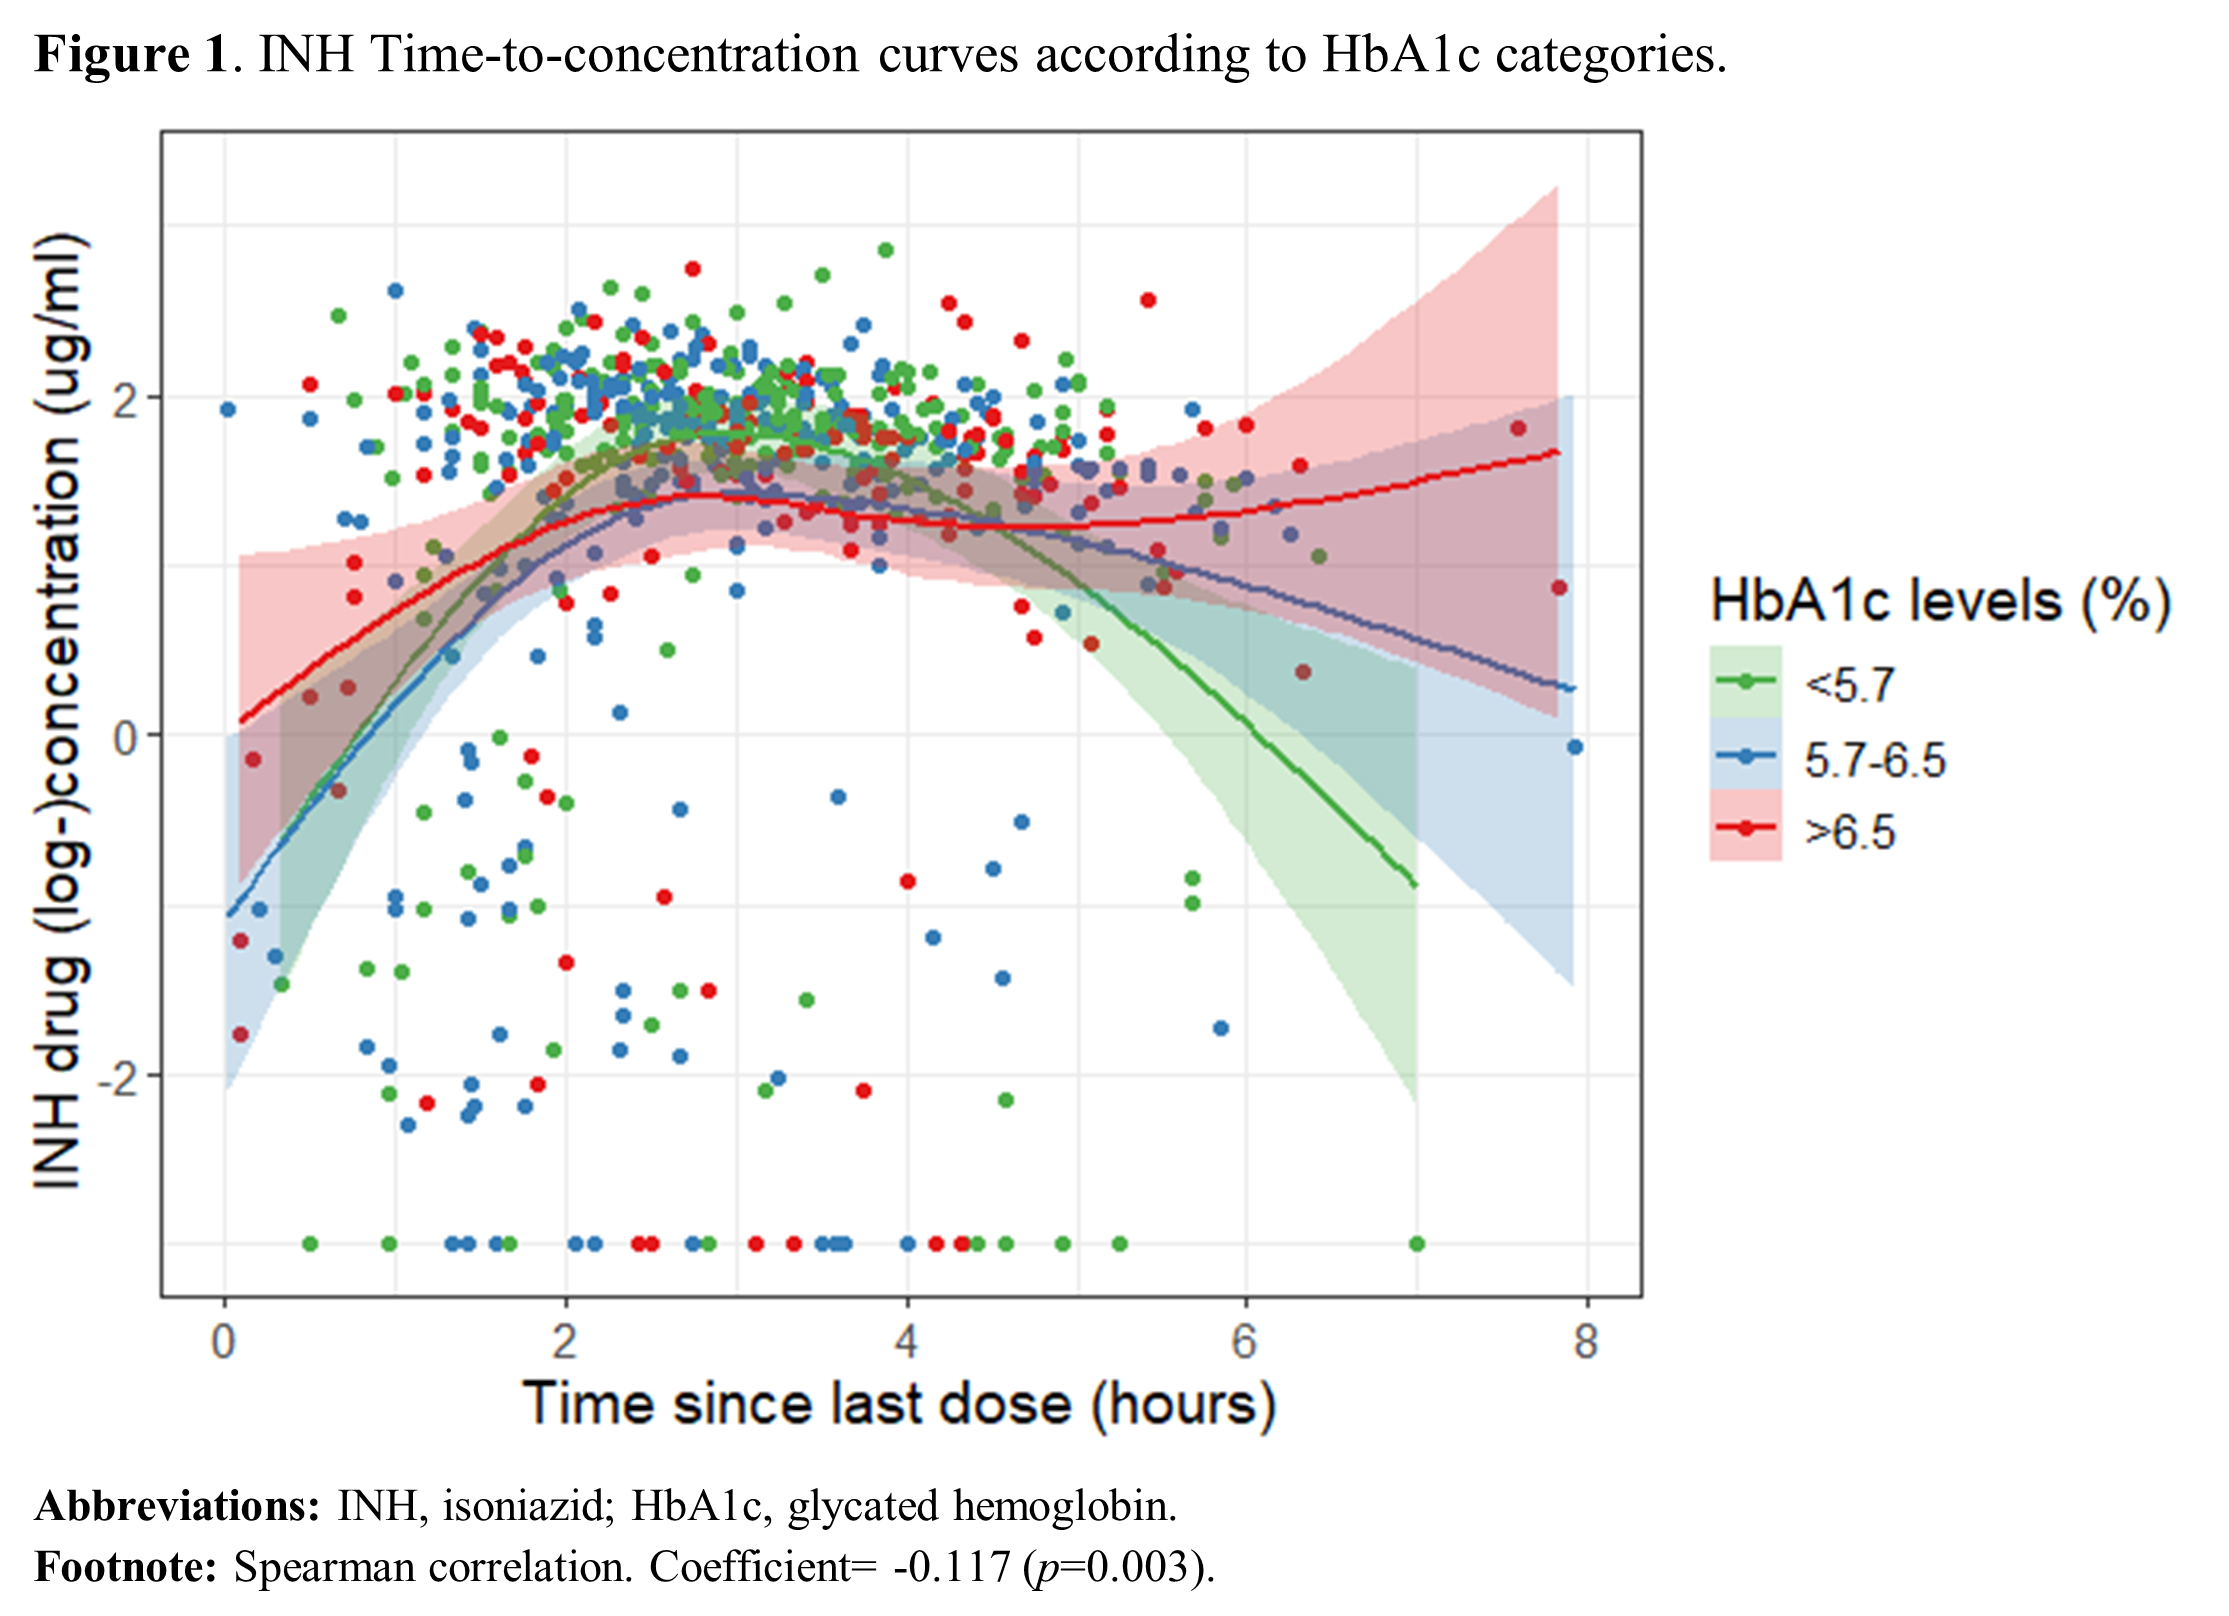
There were 657 samples available from 379 participants who met the inclusion criteria. The median baseline HbA1c was 5.9 (Interquartile Range [IQR] 5.5-6.4); and the median time since last dose was 3 hours (IQR 2.1-3.9). There were 131 (34%) participants with normal HbA1c, 154 (41%) had pre-DM, and 94 (25%) had DM. The correlation between HbA1c level and log-INH revealed a coefficient of -0.099 (p=0.01); whereas for the HbA1c categories, the coefficient was -0.117 (p=0.003), indicating lower INH concentration among participants with pre-DM and DM (Figure 1).
Conclusions
Our study identified an inverse relationship between HbA1c and INH plasma concentration in individuals with TB and DM. Despite the weak explanatory power of the model, the significant negative association suggests that individuals with pre-DM and DM may have reduced INH exposure, which potentially contributes to the lower risk of adverse drug reactions observed in this population.
Table or Figure