
Background:
Immunological signature of Mpox has been described in the early stages of infection. Analysis of its persistence could have implications for decision-making on the need and timing of vaccination in Mpox virus (MPXV) infected subjects. We described the kinetics of humoral and cellular immune response from symptoms onset (FSO) up to 3 months after Mpox.
Methods:
9 patients (pts) with Mpox confirmed diagnosis were enrolled from May to July 2022, and blood samples prospectively collected in the early phase of infection (0-20 days) and after 3 months (T90-140). Specific-MPXV IgM/IgG and neutralizing antibodies (nAb) titers were measured by immunofluorescence assay and by 50% plaque reduction neutralization test (PRNT50). Interferon-γ producing specific T-cells to MVA peptides was assessed by ELISpot assay. In a subgroup of 6 pts, we analyzed the proportion of naïve, central memory (CM), effector memory (EM), and terminally differentiated (TEMRA) CD4+ and CD8+ T-cells and their expression of activation and exhaustion markers (CD38/CD57/PD-1) by flow cytometry. Kinetics of the cellular response were compared with 10 healthy donors matched by sex and age. Kruskal-Wallis and Dunn’s tests, Mann-Whitney and Wilcoxon test were used for statistics, as appropriate.
Results:
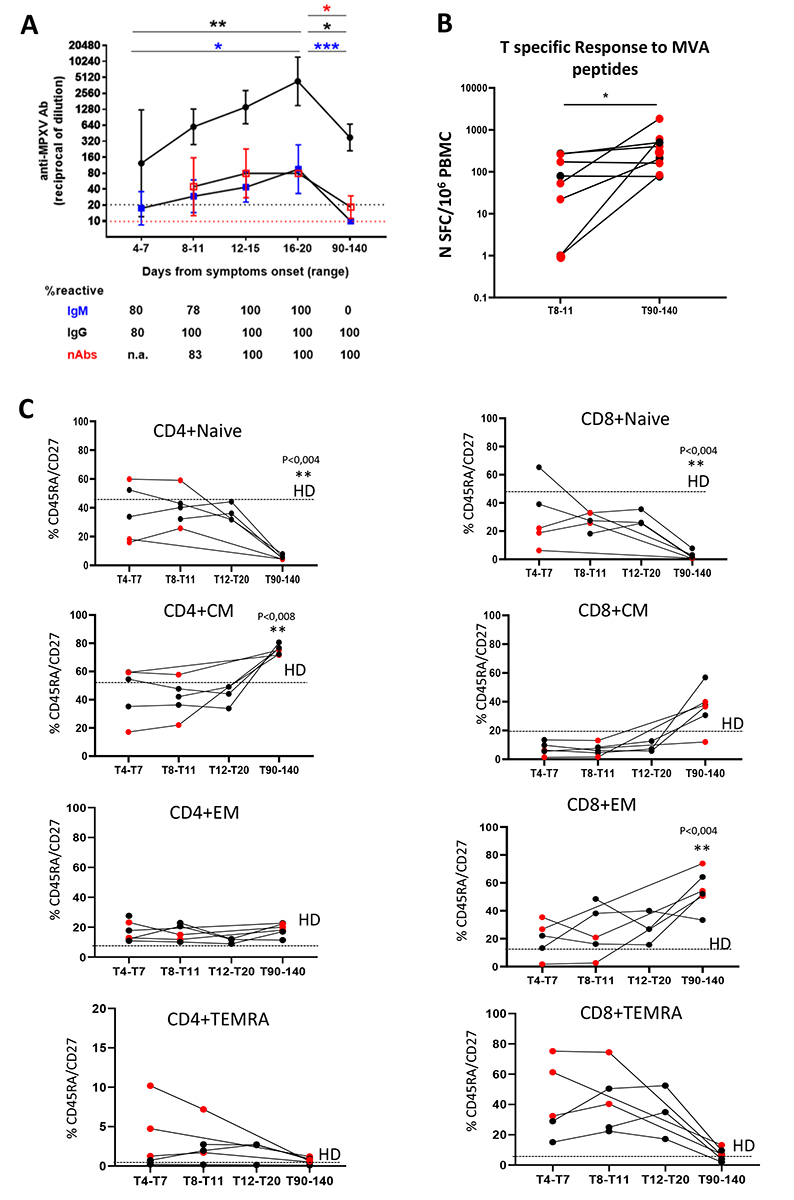
All were MSM with a median age of 39 years (IQR 31-46). 6 were PLWH, all on ART with good viro-immunological status. Only one received smallpox vaccine during childhood.In all samples, MPXV-specific IgG/IgM have been detected as early as 4 days FSO and peaked during the third week. nAb developed during the second week FSO. At T90-140, IgG and nAb were still detectable, even if at significantly lower levels than the peak (Fig1A). MVA-specific T-cells response significantly increased from T8-11 to T90-140 (Fig1B). Regarding T-cells differentiation profile, a significant expansion of CM and EM cells was observed at T90-140, differently from the higher proportion of effector cells in the acute phase of infection (Fig1C). Exhaustion and activation markers (PD-1, CD57, CD38) were increased at the beginning of infection and resulted lower after three months. No differences were observed between PLWH and not.
Conclusions:
Analysis of immune response after 3 months from MPXV infection showed detectable IgG and nAb and increased CM, EM, and MVA-specific responding T-cells, regardless of HIV infection, suggesting the possible expansion of a protective memory/effector T-cells phenotype and the persistence of immune protection.
Figure 1. A. Kinetics of anti-MPXV IgM/IgG and neutralizing antibodies (nAb). Geometric mean titers (GMT-95% CI) are shown for IgM (blue), IgG (black), and nAb (red). Dot lines represent the limit of detection for IgM/IgG (black) and nAb (red). Kruskal-Wallis and Dunn tests were performed to compare titers at different time points. P values are assigned as follows * < 0.05, ** < 0.01, *** < 0.001, and indicated in blue for IgM, black for IgG, and red for nAb. The percentage of reactive samples at each time point is displayed for the three humoral immunity markers. B. Specific T-cells response to MVA peptides was assessed by interferon-γ ELISpot assay. C. Proportion of naïve, central memory (CM), effector memory (EM), and terminally differentiated (TEMRA) CD4+ and CD8+ T-cells and their expression of activation and exhaustion markers (CD38/CD57/PD-1) assessed by flow cytometry. Kinetics of the cellular response were compared with 10 healthy donors matched by sex and age.